
Construction dashboard
Configure a practical home builder dashboard for active projects, contract volume, overdue invoices, open defects, pipeline value, service requests and current workforce figures.
Construction dashboard: how it works in Home Builder Software
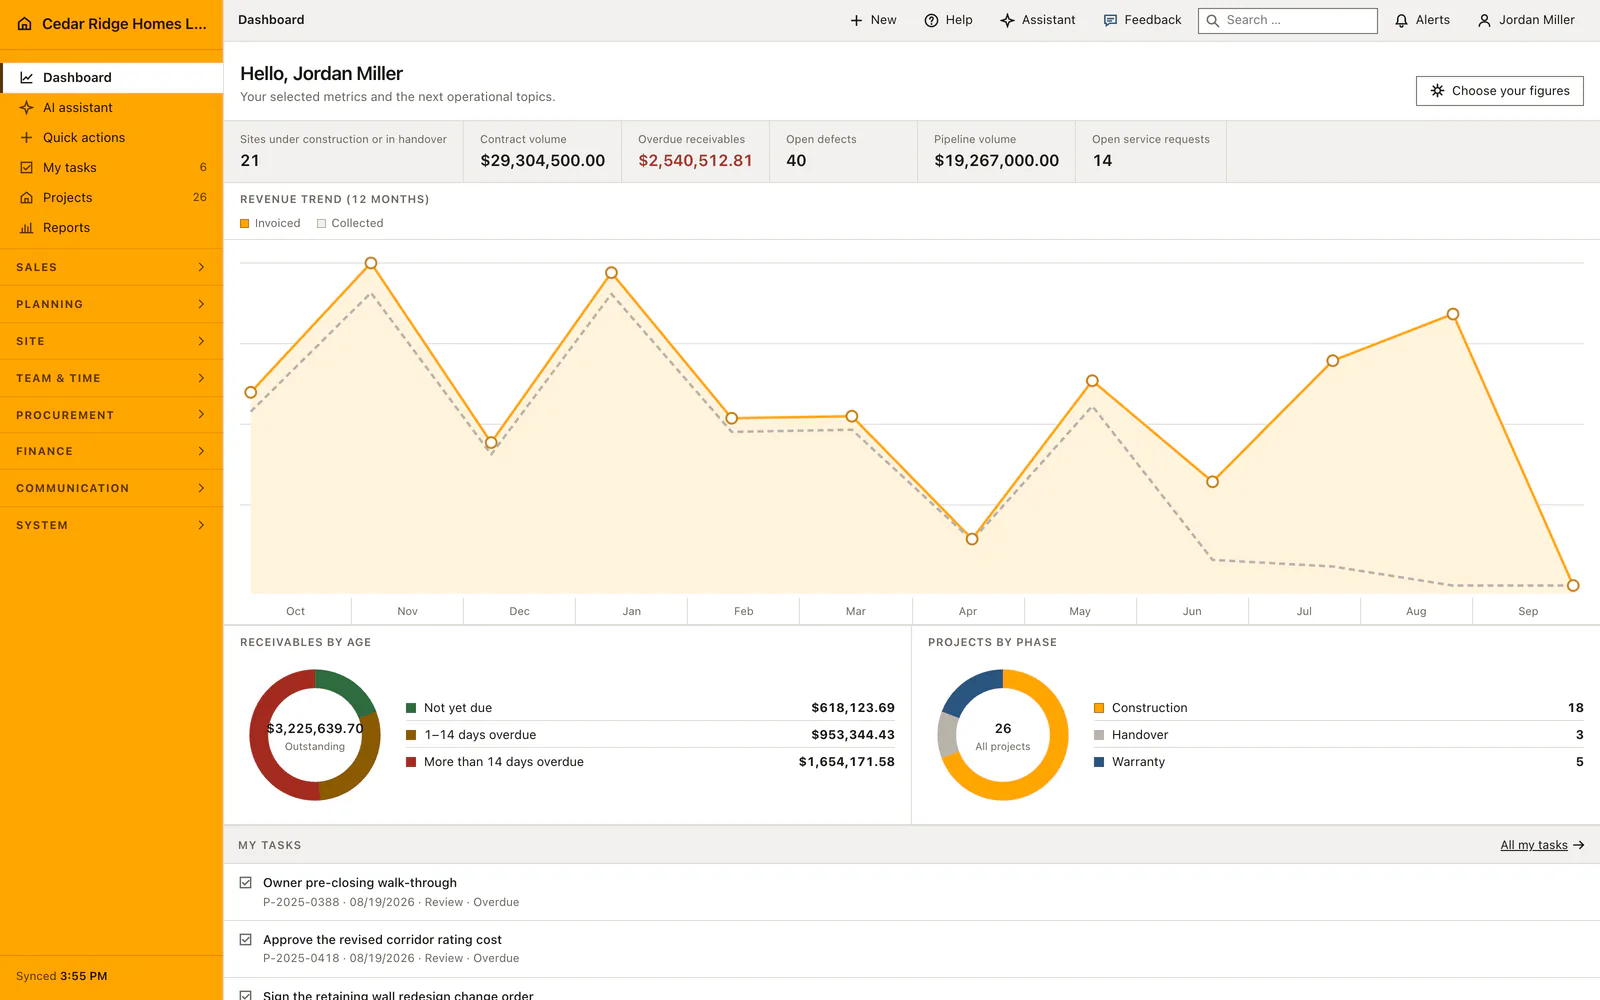
The dashboard is what opens after sign-in, and every company decides for itself what belongs on it. Setup asks for at least one company metric, and the choice sticks: active projects, contract volume, overdue invoices, open defects, pipeline volume, open service requests, team hours booked this month, colleagues off sick today. Nobody has to walk the modules one by one to find out whether the day starts calmly or badly.
Configure dashboard reopens the selection at any time, and the chosen tiles are saved for the company rather than for one person. Permissions decide what can appear at all: a site role without finance rights never gets contract volume on the start page. Below the tiles sit the projects touched most recently and the service requests still open, each row carrying the same status color, symbol and wording used inside the module it came from.
Green for done, yellow for attention, red for risk, blue for running, gray for neutral: the color code is identical across the system, so a red figure on the start page means exactly what it means in invoices or defects. Every tile and every row is a door into the record behind it, which is why the morning look at the numbers usually ends inside a project file rather than in a spreadsheet.
Picking dashboard figures in the setup wizard and under Choose your figures
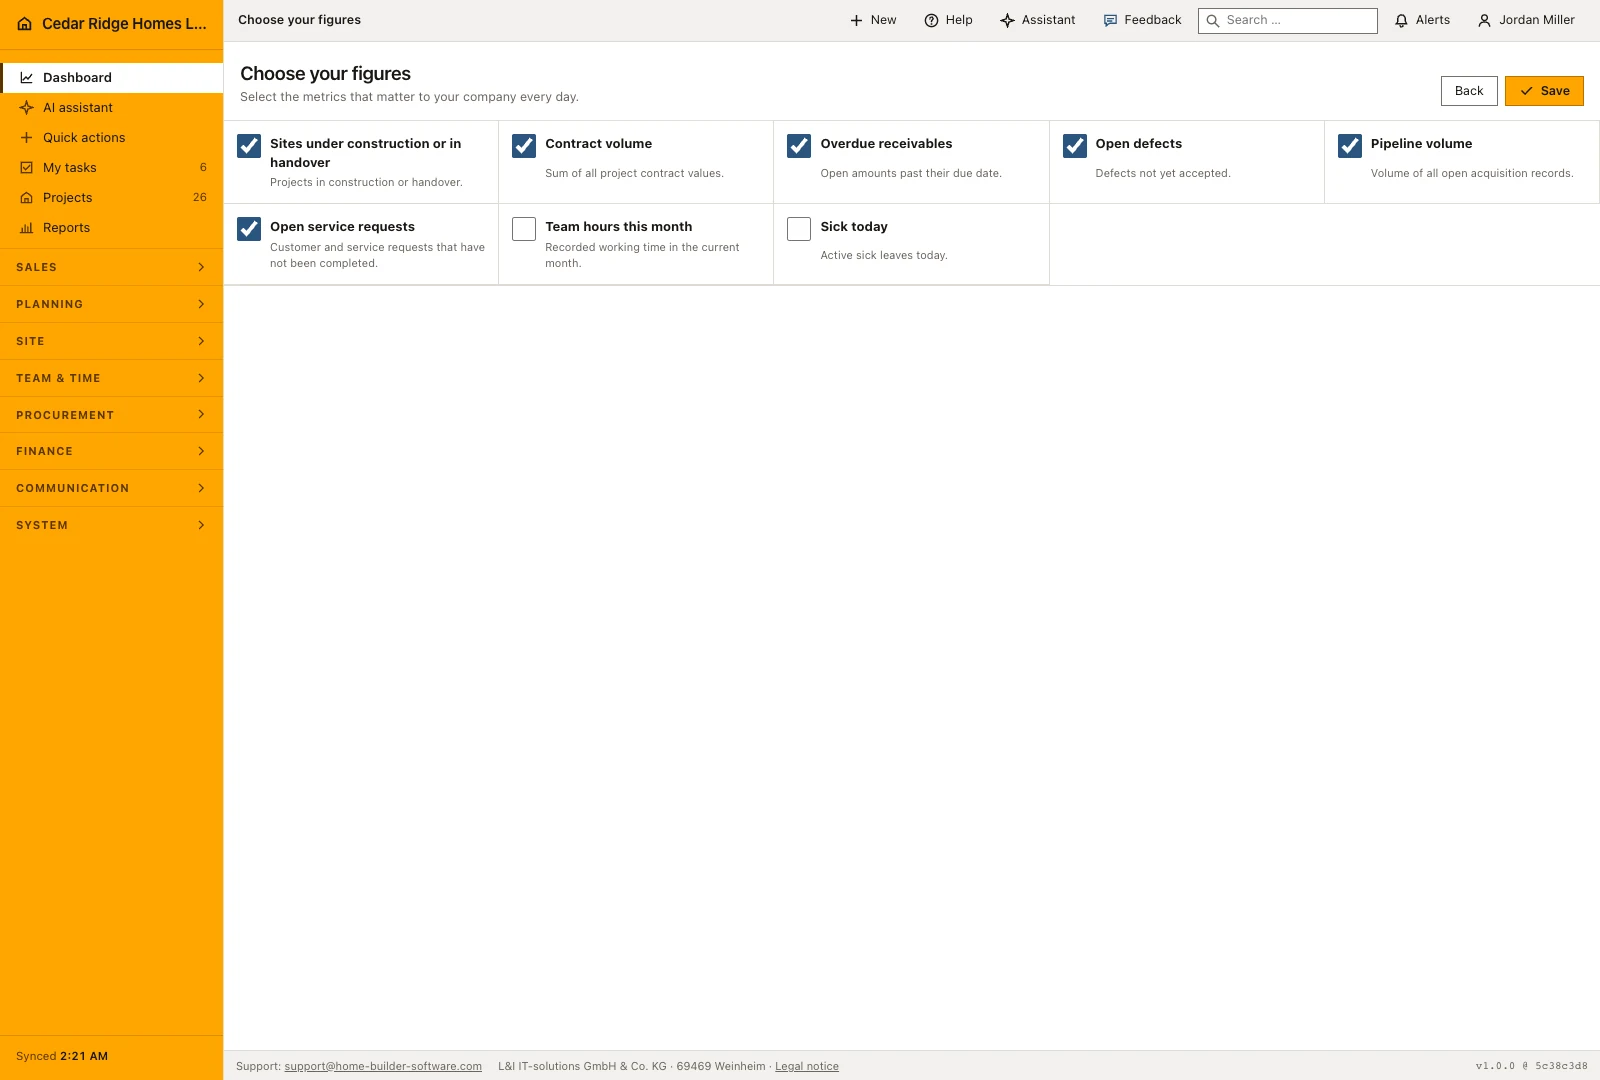
Choose the figures your company uses to decide what needs attention: active sites, contract volume, overdue receivables, open defects, pipeline volume or service requests. The setup wizard provides an initial selection. That selection belongs to the company, so colleagues start from the same agreed priorities when they sign in, subject to the information their role may view.
The Choose your figures control reopens the selection when priorities change. A person authorized to manage company settings can adjust it, keeping at least one figure selected. For example, a team approaching handover can emphasize unresolved defects and service work, while the office continues to follow receivables. Changing the selection changes the starting view; it does not change the project records behind those figures.
 Open full-size screenshot
Reading the revenue curve, the receivables donut and the phase mix
The revenue trend puts invoiced amounts and collected payments on the same timeline. This helps distinguish a busy billing month from a month in which the money actually arrived. A growing distance between the two is a reason to review the open invoice register and individual payment receipts before treating the invoiced amount as available cash.
Receivables by age separates balances that are not yet due from those already overdue, with the total in the center. Projects by phase shows the mix of construction, handover and warranty work. Read the labels as well as the colors: the whole portfolio and the active-site count answer different questions, and both are useful when deciding where to spend the next hour.
From a tile into the project file, the ticket or the reports page
Each list under the tiles is a way into a record. A number in Recently updated projects opens the project file and makes that project the active one for the modules visited next, which is why a defect created straight afterwards already knows its site. A row in Open service requests opens the ticket with its subject and assignee. A task row opens the task, and All my tasks leads to the personal task page.
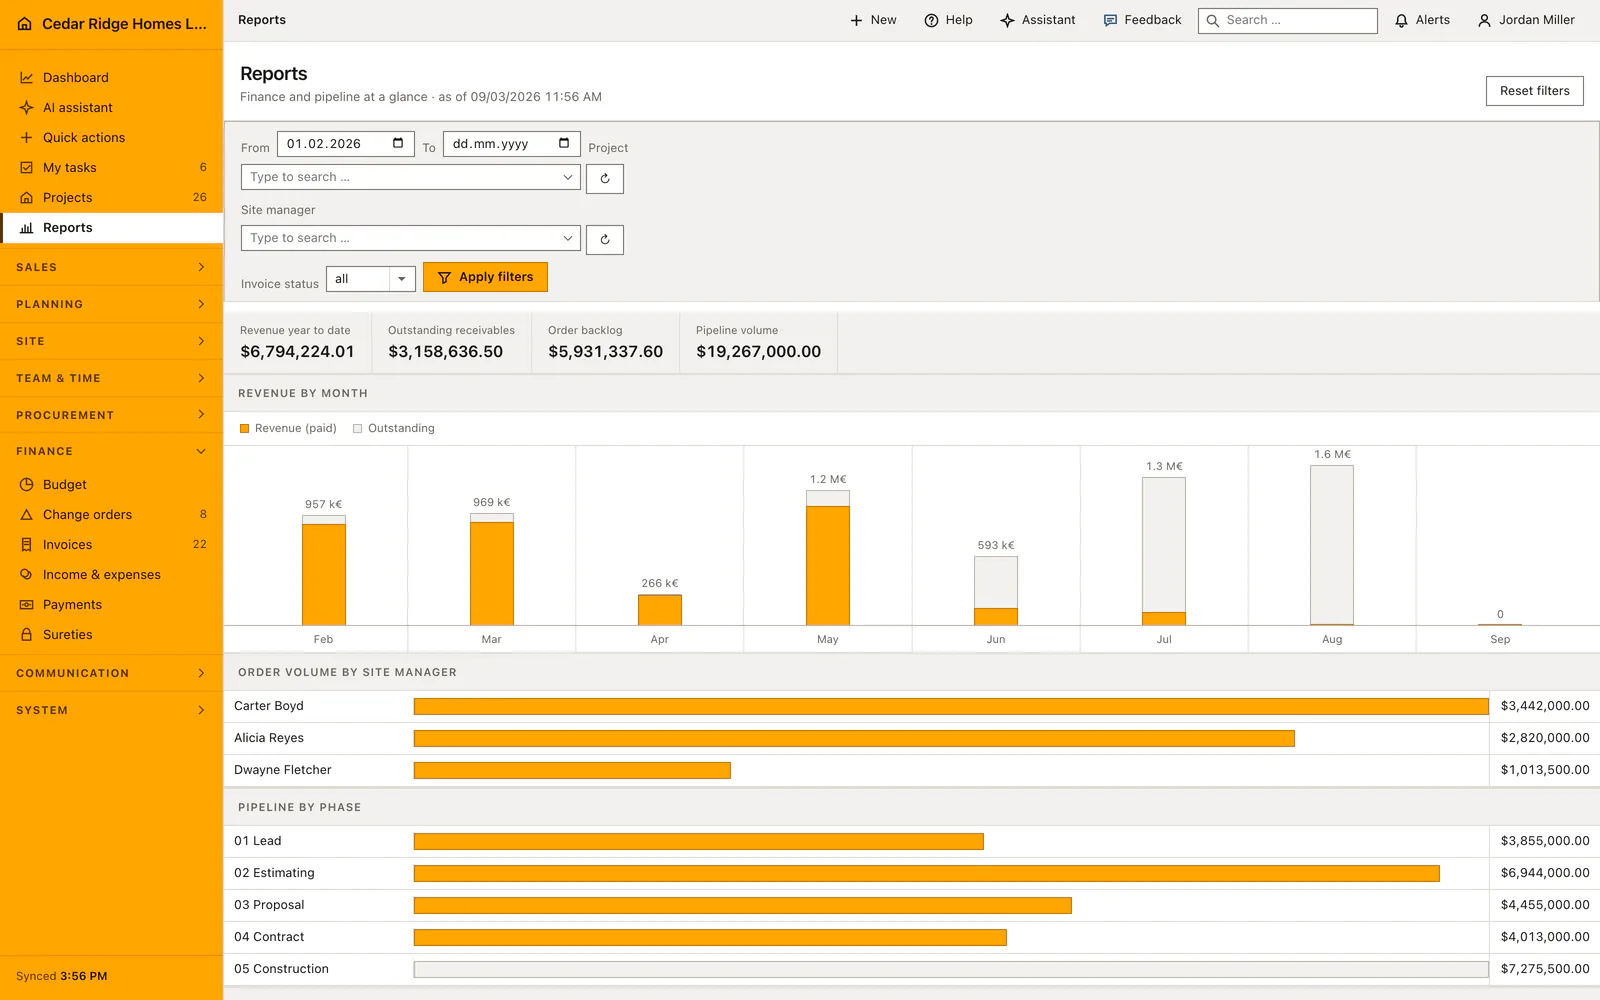
Where the start page answers how much, the Reports module answers where the figure came from: revenue by month with the paid and unpaid share, contract volume per site manager, pipeline by stage and open items by age, each stamped with the date and the number of documents behind it. A company that has not created a project yet sees neither tiles nor charts but one sentence and a button that starts the first site.
 Open full-size screenshot
Construction dashboard in the daily routine
Site management opens the start page before the first call of the day, reads the handful of tiles the company agreed on, and follows the red one into the record that caused it. The list of recently edited projects shows where colleagues worked yesterday, while open service requests show what a customer reported overnight. When priorities shift, an administrator swaps a tile through Configure dashboard, and everyone in the company sees the new selection on the next sign-in.
Read the documentationConstruction dashboard: what it covers
Choose the company metrics that matter for the starting view
Review recently updated projects and open service requests
Use consistent status colors with text and symbols across modules
Construction dashboard: questions and answers
Can each company configure its dashboard?
Yes. The selected metrics are saved for the company and can be changed from the dashboard.
Which figures can the dashboard show?
Available figures include active projects, contract and pipeline volume, overdue receivables, open defects and service requests, team hours and sickness.
Use Construction dashboard on your own projects
Request a trial period for the workflow around this module. We agree the roles, permissions and useful scope with you before preparing access.