
Construction dashboard: setup and daily use
The dashboard is the page a sign-in lands on, and its content belongs to the company rather than to one person. Choose your figures picks from eight available metrics, and each one is calculated only for a role that carries the matching permission. Below the tiles sit a revenue curve, two donuts, the work addressed to the signed-in user, the recently updated projects and the service requests still open.
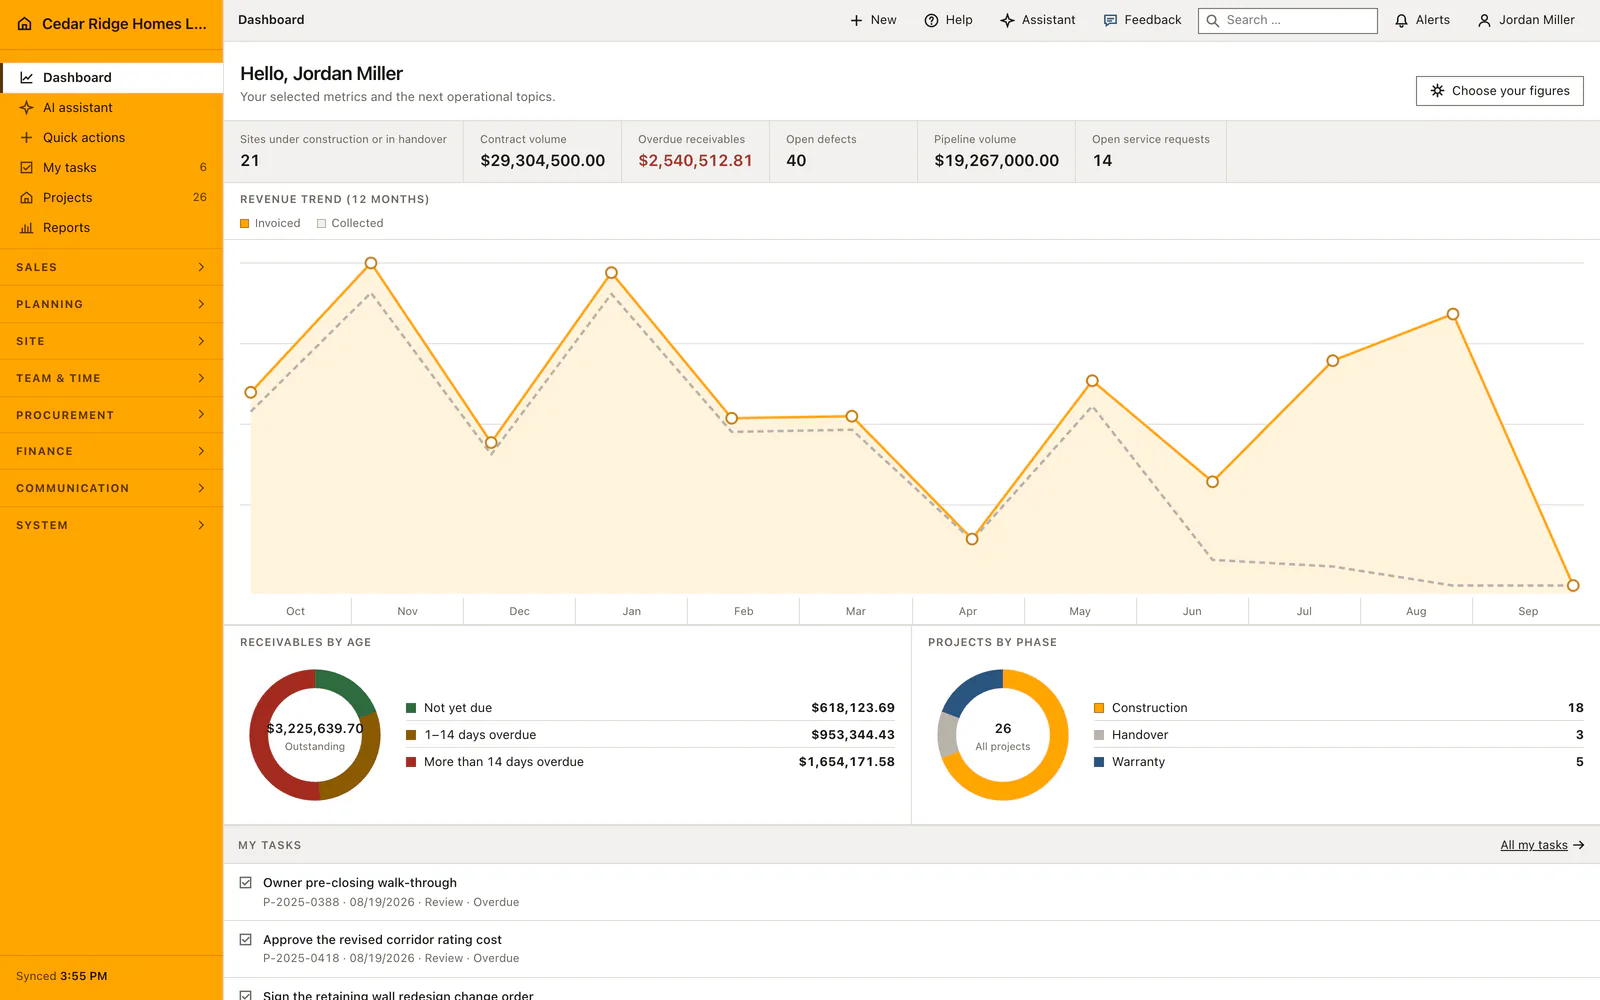
Picking dashboard figures in the setup wizard and under Choose your figures
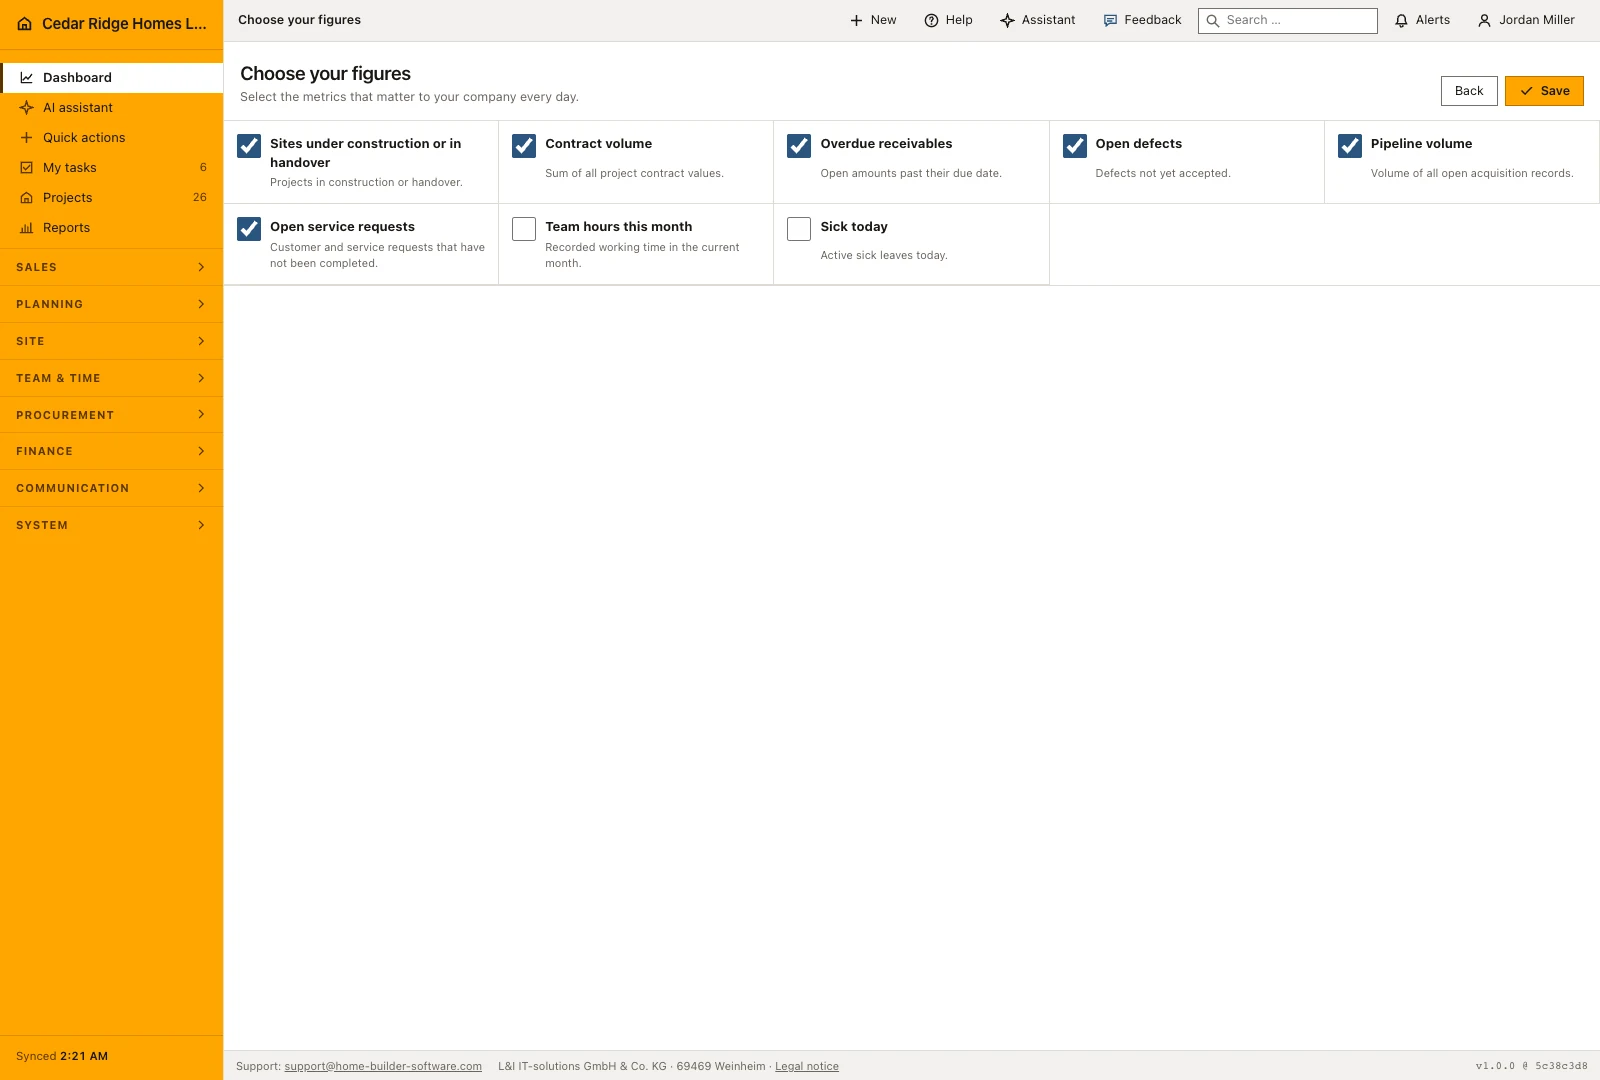
The dashboard step of the setup wizard is where a company answers this question for the first time, and the wizard cannot be completed before it has been answered. Taking the default path writes a workable selection immediately: sites under construction or in handover, contract volume, overdue receivables, open defects, pipeline volume and open service requests. The list is stored on the company record as dashboard_metrics, so a colleague signing in from another device opens the same start page.
Afterwards the gear button in the page head, labeled Choose your figures, reopens exactly that selection. Only a role holding settings.manage can reach it, and the form rejects an empty list because at least one metric has to stay ticked. Saving records the audit entry dashboard.configured together with the chosen keys, which is how a start page that looks different this morning can be traced back to the person who changed it yesterday.
What each dashboard tile actually counts
Sites under construction or in handover counts the projects Home Builder Software treats as active, which is why it reads lower than the number beside Projects in the navigation. Contract volume adds up contract_sum across every project on the books. Overdue receivables adds the open_amount of invoices whose due_date has passed, and the tile turns red as soon as that sum is above zero. Open defects counts defects in any status other than accepted.
Pipeline volume sums the volume of opportunities still on status open. Open service requests counts tickets that have not reached closed. Team hours this month converts the minutes booked since the first of the month into hours with one decimal place. The tile labeled Sick today counts every absence record whose span covers the current date, and since the kind column arrived that is reported illness and booked holiday together, so it answers who is away today rather than who is ill. Amounts are printed in the company currency, counts as plain numbers, and both carry the label of what they measure.
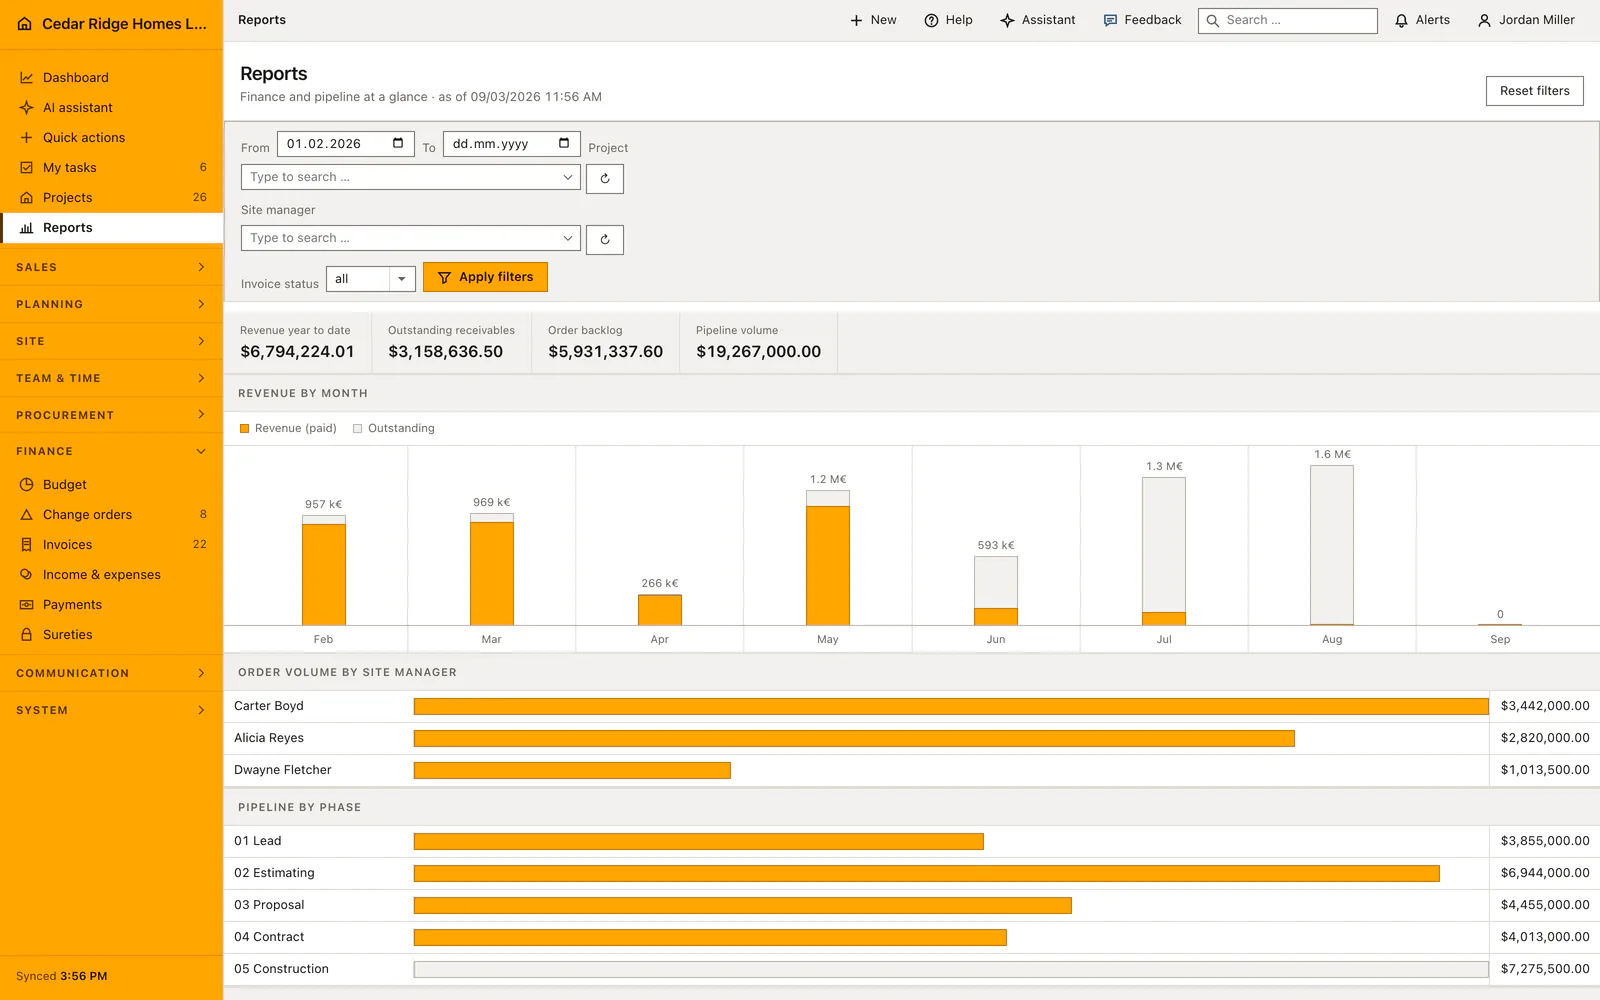
Reading the revenue curve, the receivables donut and the phase mix
Revenue trend draws two lines across the last twelve calendar months. Invoiced is the gross of every invoice in that month except credit notes, while Collected is what has genuinely arrived, with retainage that is still withheld left out of the figure. The twelve points are aggregated inside the database rather than assembled in the browser, so a company with several years of invoices still gets the chart without a wait.
Receivables by age reads the outstanding total as a traffic light: green for what is still inside its payment term, amber for what has passed due_date by no more than a fortnight, red for whatever has been waiting longer, and the total is repeated in the center. Projects by phase counts every project on the books and labels its center All projects, which is deliberately a wider figure than the active-sites tile. Between the charts and the project table stands the work addressed to the signed-in person, overdue first.
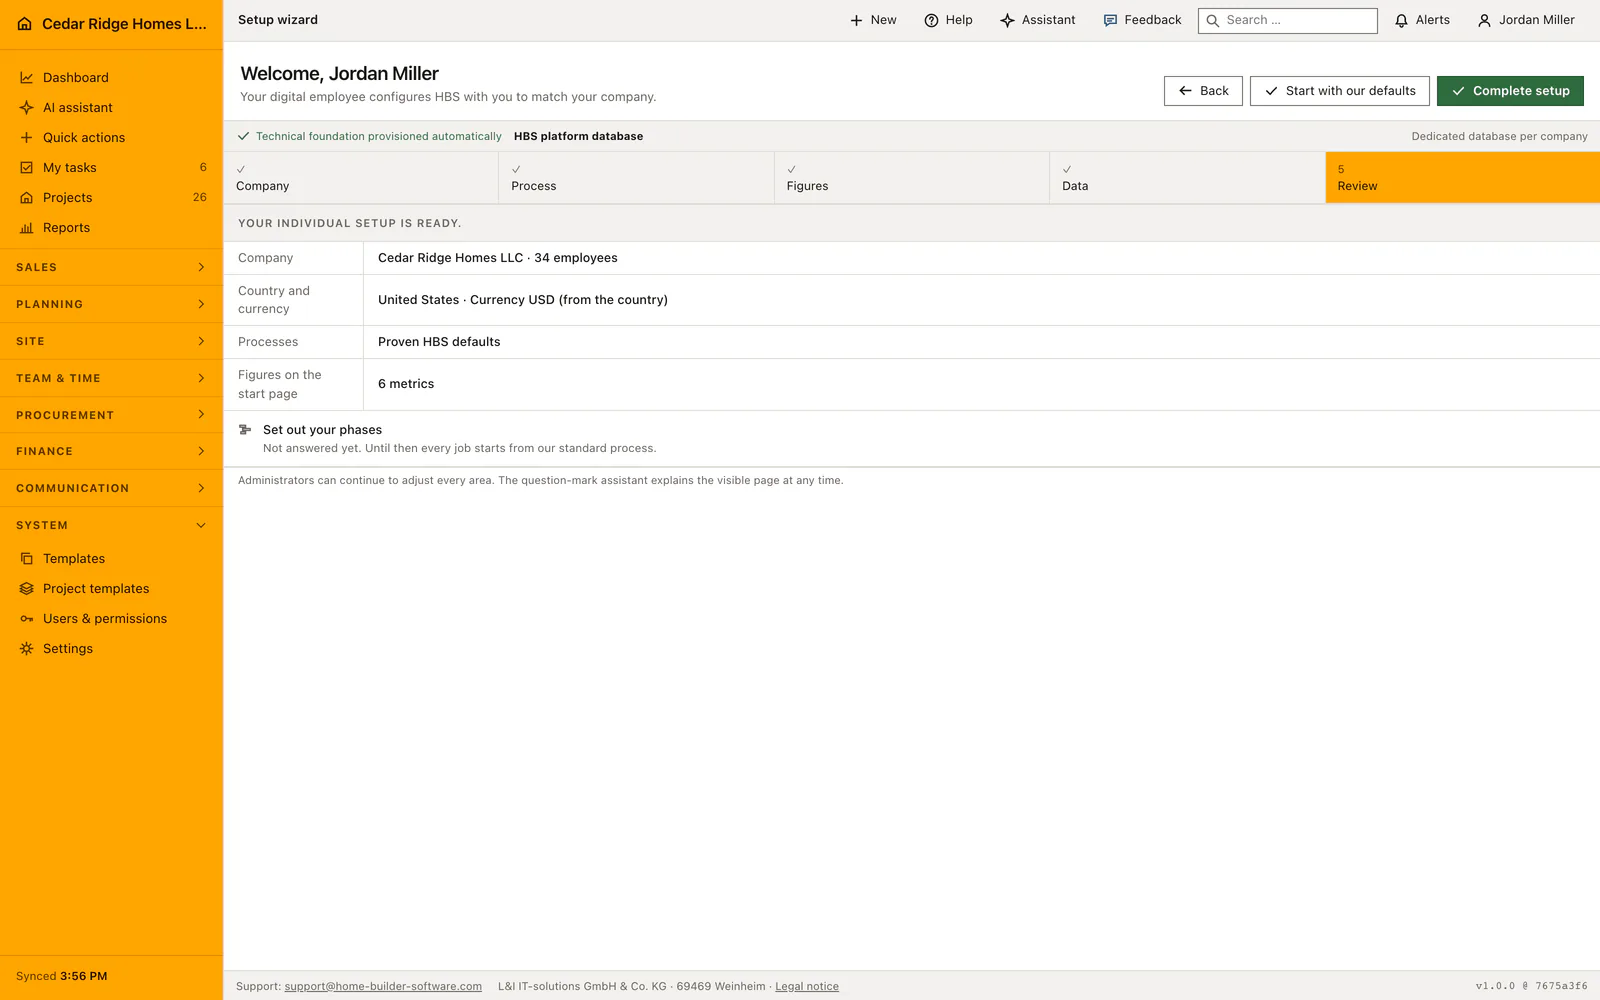
Which role sees contract volume and which sees only counts
Every metric names one permission and is calculated only when the signed-in user actually holds it. Contract volume, overdue receivables and pipeline volume need finance.view. Sites under construction, open defects and open service requests need projects.view. Team hours this month and sick today need workforce.view. A figure somebody may not see is never computed at all, so it cannot slip onto the page through a forgotten condition in a template.
The charts follow the same split: both money charts need finance.view, the phase donut needs projects.view, and the personal task block appears with workforce.view. A field role therefore lands on a shorter but complete page instead of on empty boxes. Changing the selection stays with settings.manage, and because the choice is stored per company, an administrator is deciding for every colleague and not only for the browser in front of them.
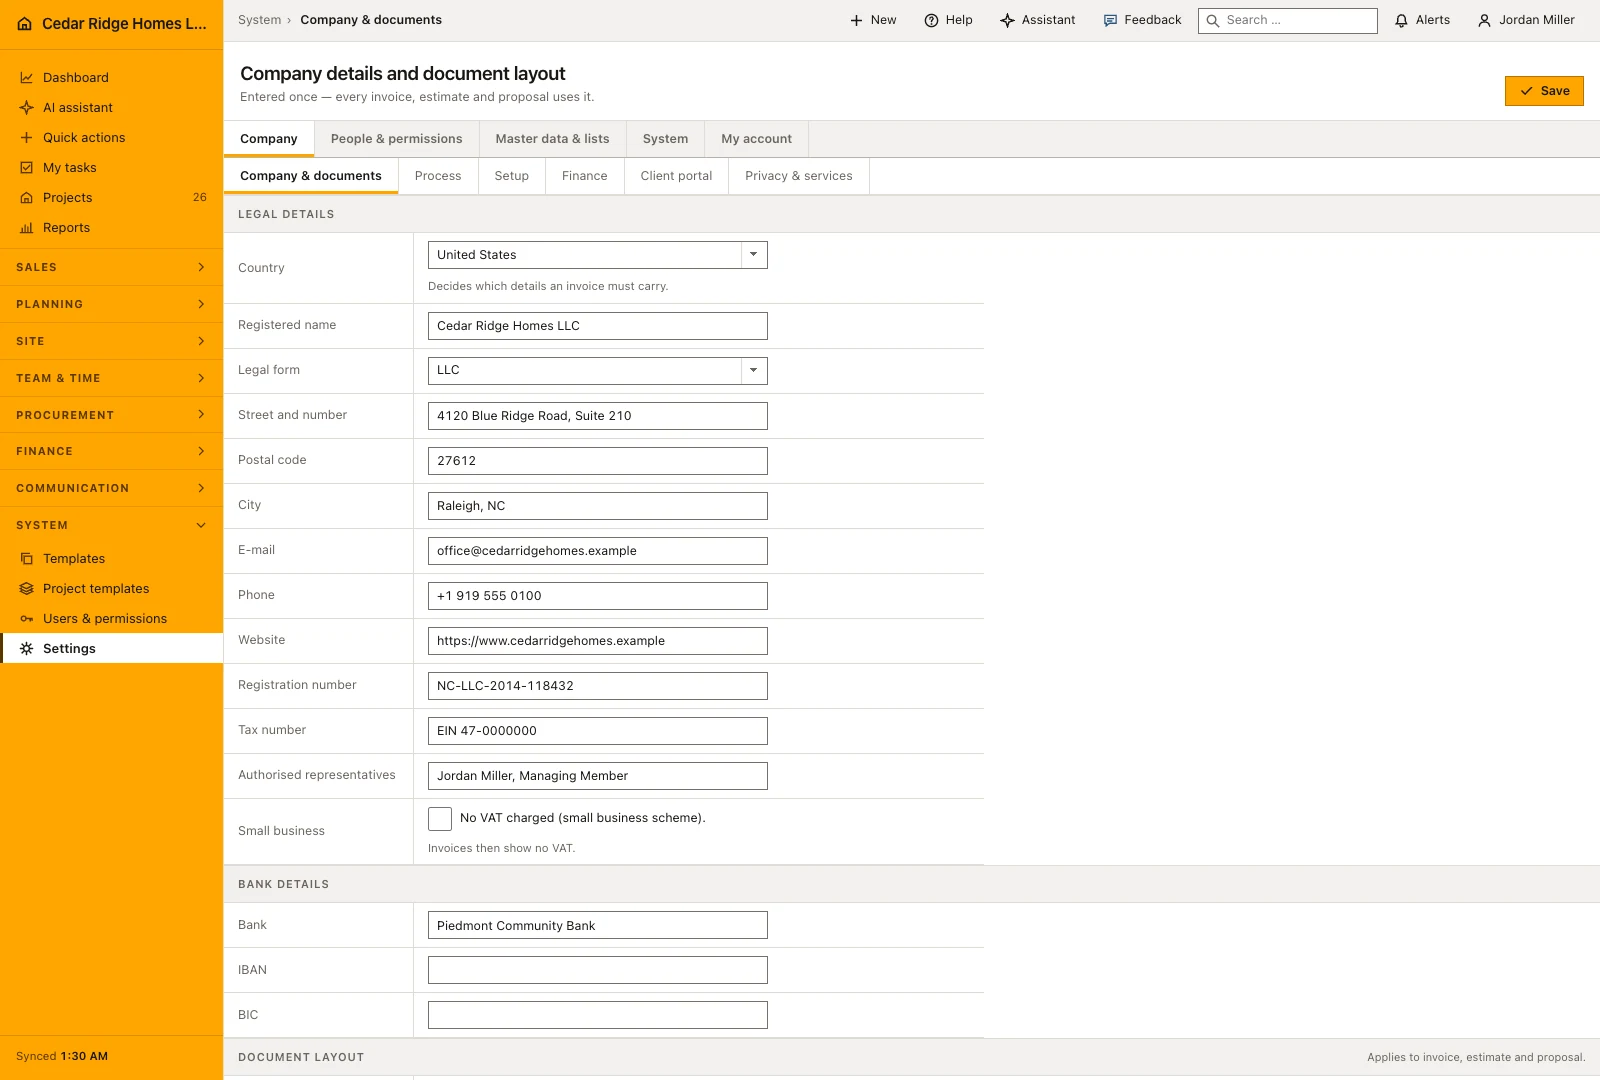
From a tile into the project file, the ticket or the reports page
Each list under the tiles is a way into a record. A number in Recently updated projects opens the project file and makes that project the active one for the modules visited next, which is why a defect created straight afterwards already knows its site. A row in Open service requests opens the ticket with its subject and assignee. A task row opens the task, and All my tasks leads to the personal task page.
Where the start page answers how much, the Reports module answers where the figure came from: revenue by month with the paid and unpaid share, contract volume per site manager, pipeline by stage and open items by age, each stamped with the date and the number of documents behind it. A company that has not created a project yet sees neither tiles nor charts but one sentence and a button that starts the first site.
A worked dashboard example: overdue receivables at Cedar Ridge Homes
Cedar Ridge Homes LLC in Raleigh has issued progress invoice INV-2026-1038 for Willow Creek Lot 27 over $172,588.79 gross, due on 08/16/2026, and invoice INV-2026-1040 for Kensington Row Lot 3 over $66,134.64, due on 08/17/2026. Neither has been paid when the owner signs in on the morning of 08/19/2026. The receivables donut therefore places both in the amber band of documents between one day and a fortnight late, where their open amounts add up to exactly $238,723.43. Documents that have been waiting longer than a fortnight carry a further $1,415,448.15 and fill the red segment of the same ring.
The tile for overdue receivables adds the amber and the red band together, prints $1,654,171.58 and switches to red lettering, while the center of the donut keeps the whole outstanding amount of $3,158,636.50, of which $1,504,464.92 still sits inside its payment terms. Nobody typed any of these figures: they moved on their own as each due date passed. From the tile the owner opens the filtered invoice list and starts a dunning run, and once the payments for the newer pair arrive, the tile falls back to $1,415,448.15 at the next sign-in.
Construction dashboard: checks before saving
Choose your figures refuses an empty list, so at least one metric has to stay ticked before the selection can be saved.
A metric whose permission the signed-in role lacks is never calculated, which keeps an amount off the page instead of merely hiding it.
Opening Choose your figures requires settings.manage, and the saved selection applies to the whole company rather than to the person who saved it.
Saving writes a dashboard.configured audit entry naming the chosen metrics, so a changed start page can be traced to its author.
Construction dashboard: common mistakes
The active-sites tile and the center of the phase donut count different things: the tile holds sites under construction or in handover, the donut holds every project, warranty included. Reading one as a correction of the other starts a search for nothing.
Choosing figures that only office roles may see leaves site roles with a thinner start page. Compare the selection against the roles that actually use it before treating the missing tiles as a fault.
Overdue receivables counts an invoice only after its due_date has passed, so an invoice falling due today is still absent. Payment terms decide when the figure moves, not the tile.
The product page describes the same module from the business side, with the decisions it supports and the modules it connects to.
See the product pageFrequently asked questions
Can each company configure its dashboard?
Yes. The selected metrics are saved for the company and can be changed from the dashboard.
Which figures can the dashboard show?
Available figures include active projects, contract and pipeline volume, overdue receivables, open defects and service requests, team hours and sickness.
Configuring this part for your own company?
Describe the sequence you follow today and the result you need at the end of it. We can walk through the settings that produce it.