
Construction business reports: setup and daily use
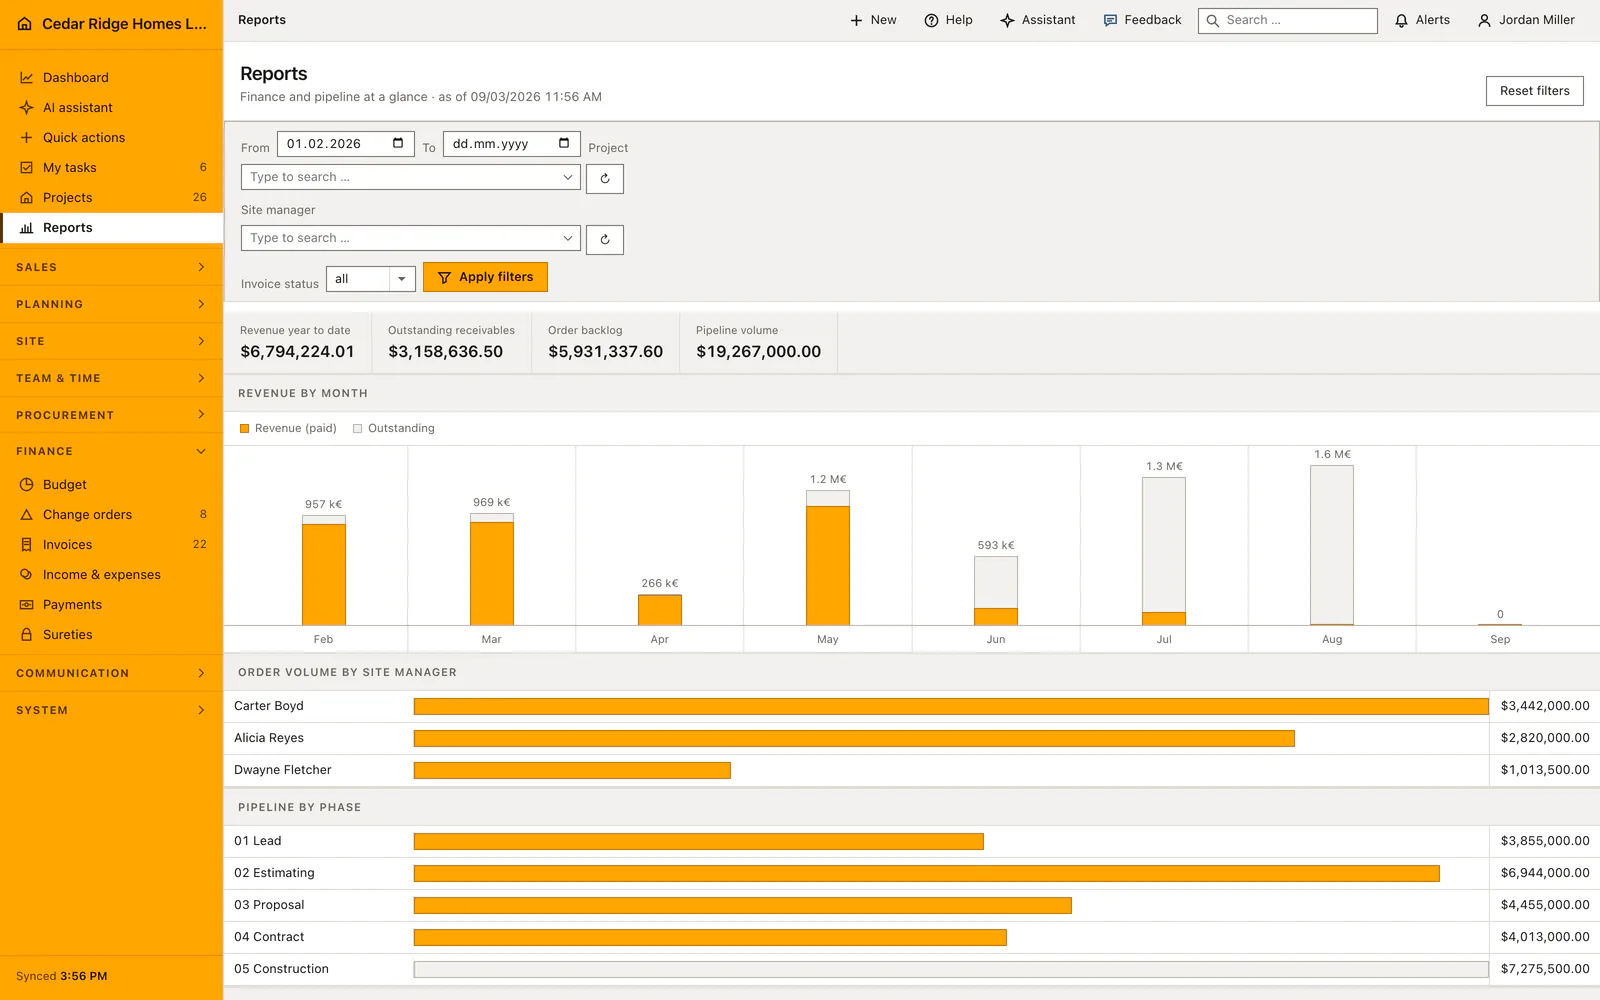
Reports answers finance and sales questions from live records and needs the reports.view permission. A filter row narrows everything by date range, project, site manager and invoice status; four figures and five charts then recalculate. Nothing is entered here and nothing is exported: the page reads invoices, projects, open opportunities and approved time entries, and a status line names the moment of the reading and how many documents it covers.
The reports.view permission and the records behind each figure
Access is a single gate. The module route carries reports.view and the controller asks the same question again, so a role without it gets a refusal rather than an empty page. Among the shipped roles, administration, site management, office and accounting, purchasing and payroll hold it; the site role does not. Because the page only reads, no write permission is involved and no figure can be changed from here.
Four sources feed the page. Invoices supply revenue, receivables and the age bands, with credit notes excluded from revenue because they are corrections. Projects supply contract sums, the backlog and the volume per site manager. Open opportunities supply the pipeline figures. Approved time entries supply the labor actuals, which means hours still waiting for approval never appear anywhere. Retention that has not been released counts as outstanding, not as collected.
Setting the date range, project, site manager and invoice status
The filter row sits above the figures and applies to all of them at once. Without an explicit start date the page covers the last eight months, which is also the span the monthly chart draws; a start date reaching further back is accepted. The end date must not fall before the start date. Invoice status offers draft, open, overdue, paid and settled, and a project or site manager outside the company is refused.
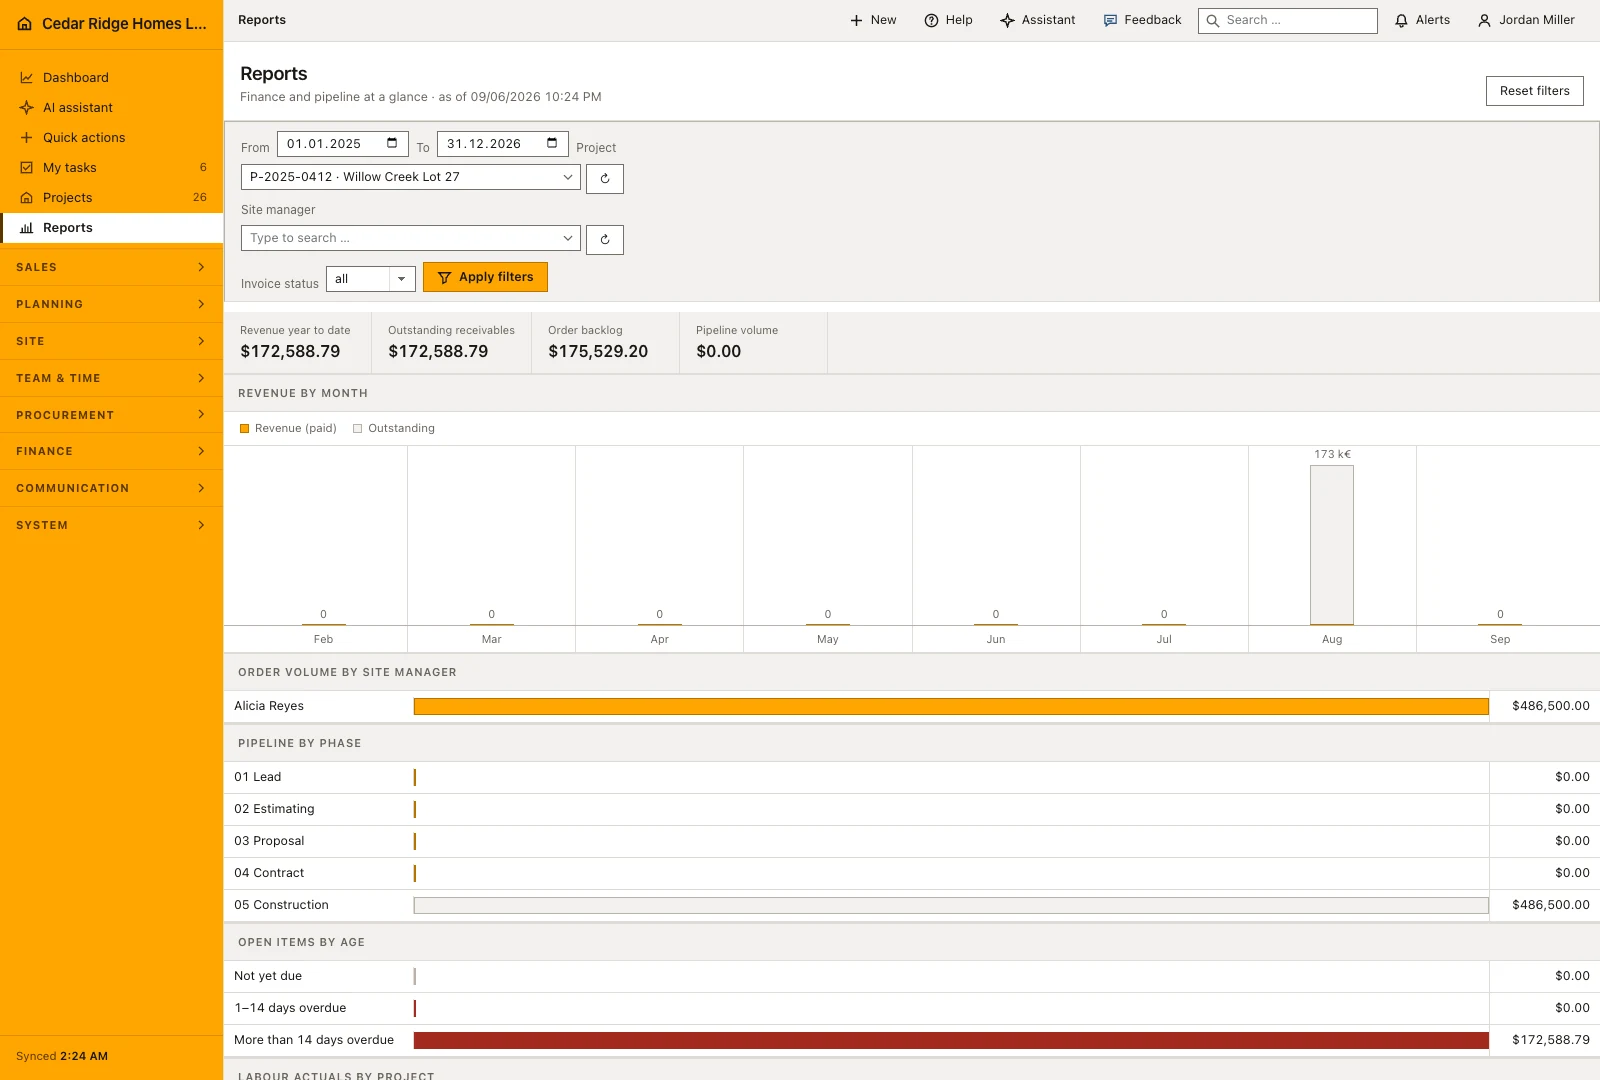
Choosing one project narrows invoices, contract figures and labor to that job, and the pipeline chart empties, because an opportunity is not yet attached to a project. Choosing a site manager narrows projects and opportunities by responsibility and invoices by the jobs that person carries. A reset link appears as soon as any filter is set, and clearing it returns the page to its eight-month default.
Reading revenue by month and open items by age
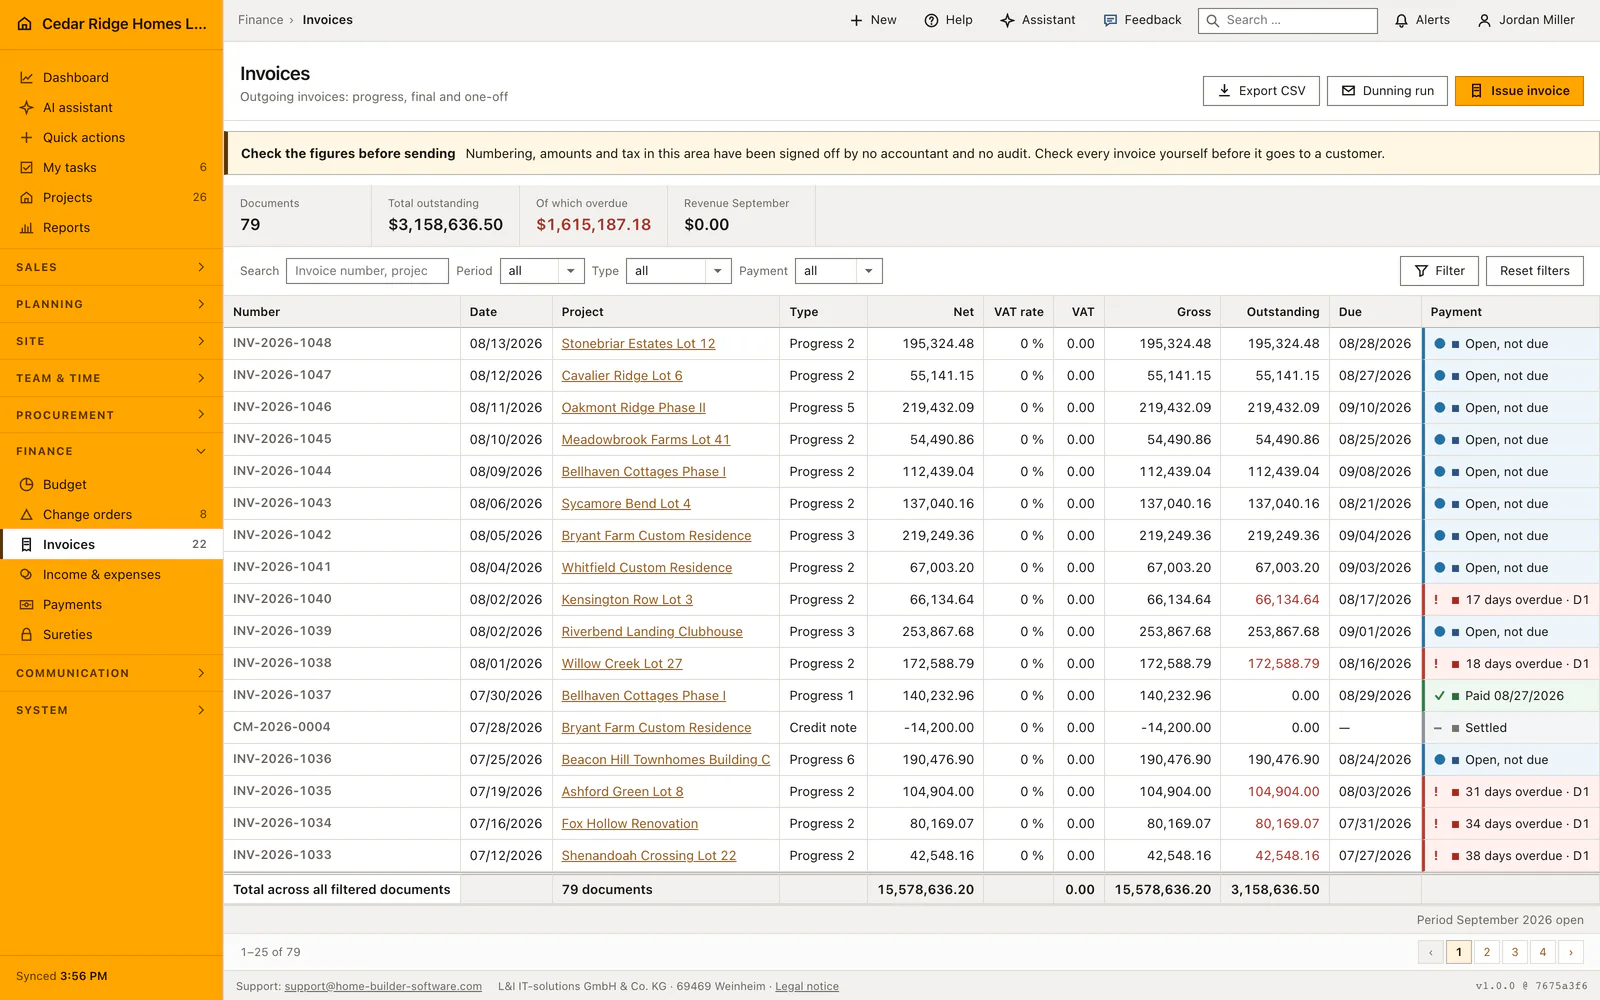
The monthly chart draws eight columns, the oldest on the left. The orange part is money collected, the gray part is still outstanding, and the compact total above each column reads in thousands or millions with the suffix of the active language. A month with no invoice shows a zero rather than a gap, which makes an empty winter visible instead of hiding it. Withheld retainage stays in the gray part until it is released.
Order volume by site manager sorts responsibility from largest to smallest and names a separate group when a job carries nobody. Pipeline by phase lists the four sales stages and adds running construction in a neutral tone for comparison. Open items by age splits outstanding balances into not yet due, one to fourteen days overdue and more than fourteen days overdue, both late bands drawn in red. Labor actuals group approved hours and their cost by project number.
Restricted project access and the document count under the charts
The figures obey the same boundaries as the modules they read. A user restricted to named jobs sees only those jobs in the contract, backlog and labor figures, because the restriction is a global scope on the data model rather than a condition rebuilt in one place. Company records without a project, such as an opportunity, stay visible where the role permits them. Nobody can widen the view from this page.
Traceability comes from the status line at the foot: the moment the page was read and the number of invoice documents that went into it. Two people opening the page at different times will therefore see different numbers, and the line says so. Since the page holds no export, a figure that has to leave the company is taken from the module it came from, where the underlying documents can be listed one by one.
From the aging chart into invoices, payments and pipeline
Reports names the problem; the modules solve it. An overdue band that is too large is worked in invoices, where the same documents can be filtered by payment state and a dunning run started. The collected share of a month moves when an incoming payment is matched in the payments module, either by hand or from a bank import. Nothing has to be recalculated afterwards, and the next opening of the page shows the new split.
The pipeline figures come from open opportunities, so a card moved on the Kanban board changes the phase chart, and a contract converted into a project moves its volume from the pipeline into the backlog. Order volume by site manager reflects what the project files say about responsibility, which makes a change of site manager in a project file visible here without any further entry. A corrected contract sum works the same way.
Worked example: overdue receivables read from the reports page
On August 19, 2026 the accounting colleague of Cedar Ridge Homes LLC opens the page without a start date, so it covers January through August. The tiles read 8,583,584.72 dollars of revenue for the year, 3,158,636.50 dollars outstanding, an order backlog of 7,022,041.60 dollars and 19,267,000.00 dollars of pipeline volume. Open items by age splits the outstanding sum into 1,543,449.32 dollars not yet due, 412,571.63 dollars between one and fourteen days late and 1,202,615.55 dollars older than that; the two red bands together give exactly the 1,615,187.18 dollars the overdue figure announces.
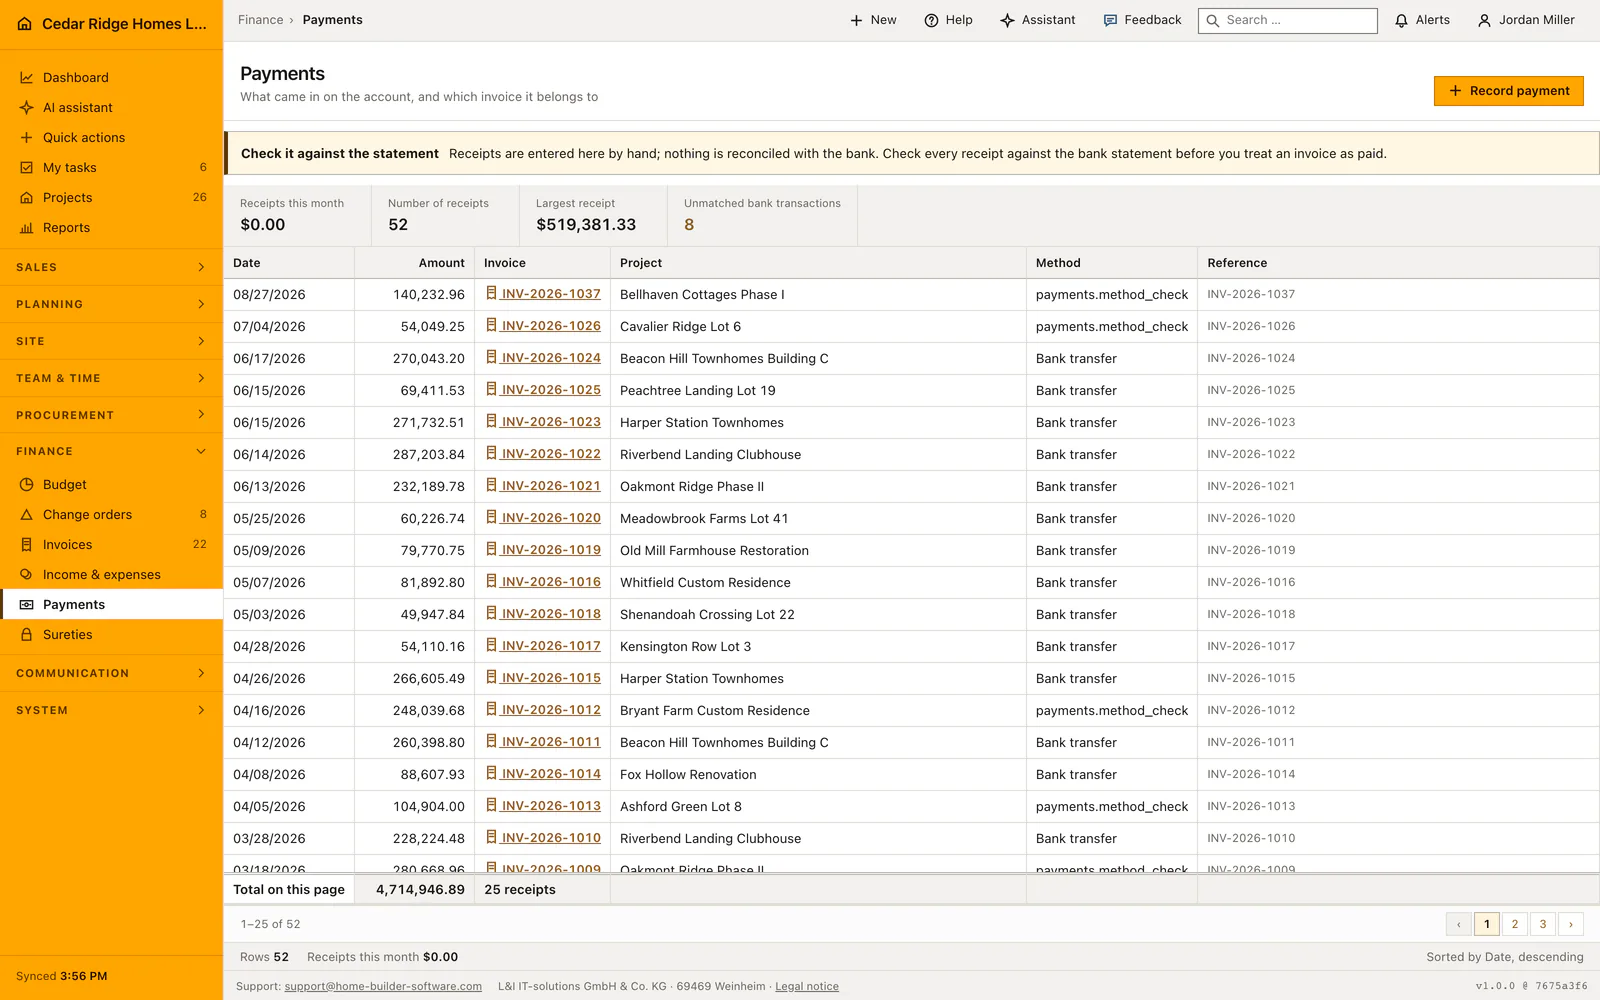
Acting on the finding happens in the modules. The invoice list shows INV-2026-1038 for Willow Creek Lot 27 among the young overdue cases, 172,588.79 dollars and three days past its due date, and the reminder goes out the same morning. Once Willow Creek Partners LLC pays and the receipt is matched in payments, the younger red band shrinks to 239,982.84 dollars and outstanding receivables drop to 2,986,047.71 dollars. The status line still counts 79 invoice documents; only the reading moment moves, which is why the colleague writes both underneath the figure quoted to the owners.
Construction business reports: checks before saving
Opening the page without reports.view is refused; the controller repeats the check the module route has already made.
An end date earlier than the start date is rejected, and a project or manager outside the company is refused as invalid.
Credit notes are left out of revenue, and retainage that has not been released stays in the outstanding band.
Labor actuals count approved time entries only, so hours still awaiting approval never reach the chart.
A user restricted to named projects sees those projects only, because the restriction applies as a global scope.
Construction business reports: common mistakes
Revenue for the running year always counts from the first of January, regardless of the date filter. Comparing it with a chart narrowed to one quarter puts two different periods side by side.
Selecting a single project empties the pipeline chart, because opportunities carry no project yet. That empty chart is the filter working, not missing data; clear the project to see the sales stages again.
The page has no export. Copying a figure into a board pack without noting the reading moment from the status line makes it impossible to say later which day the number belonged to.
The product page describes the same module from the business side, with the decisions it supports and the modules it connects to.
See the product pageFrequently asked questions
Are report figures updated from current records?
Yes. Payments and pipeline changes are reflected when the report is opened again.
Can reports show which receivables are overdue?
Yes. The receivable-age view separates not-yet-due balances from overdue age bands.
Configuring this part for your own company?
Describe the sequence you follow today and the result you need at the end of it. We can walk through the settings that produce it.