
Construction business reports
Review live revenue, receivables, backlog, pipeline, project ownership and receivable age without rebuilding the same construction report in spreadsheets.
Construction business reports: how it works in Home Builder Software
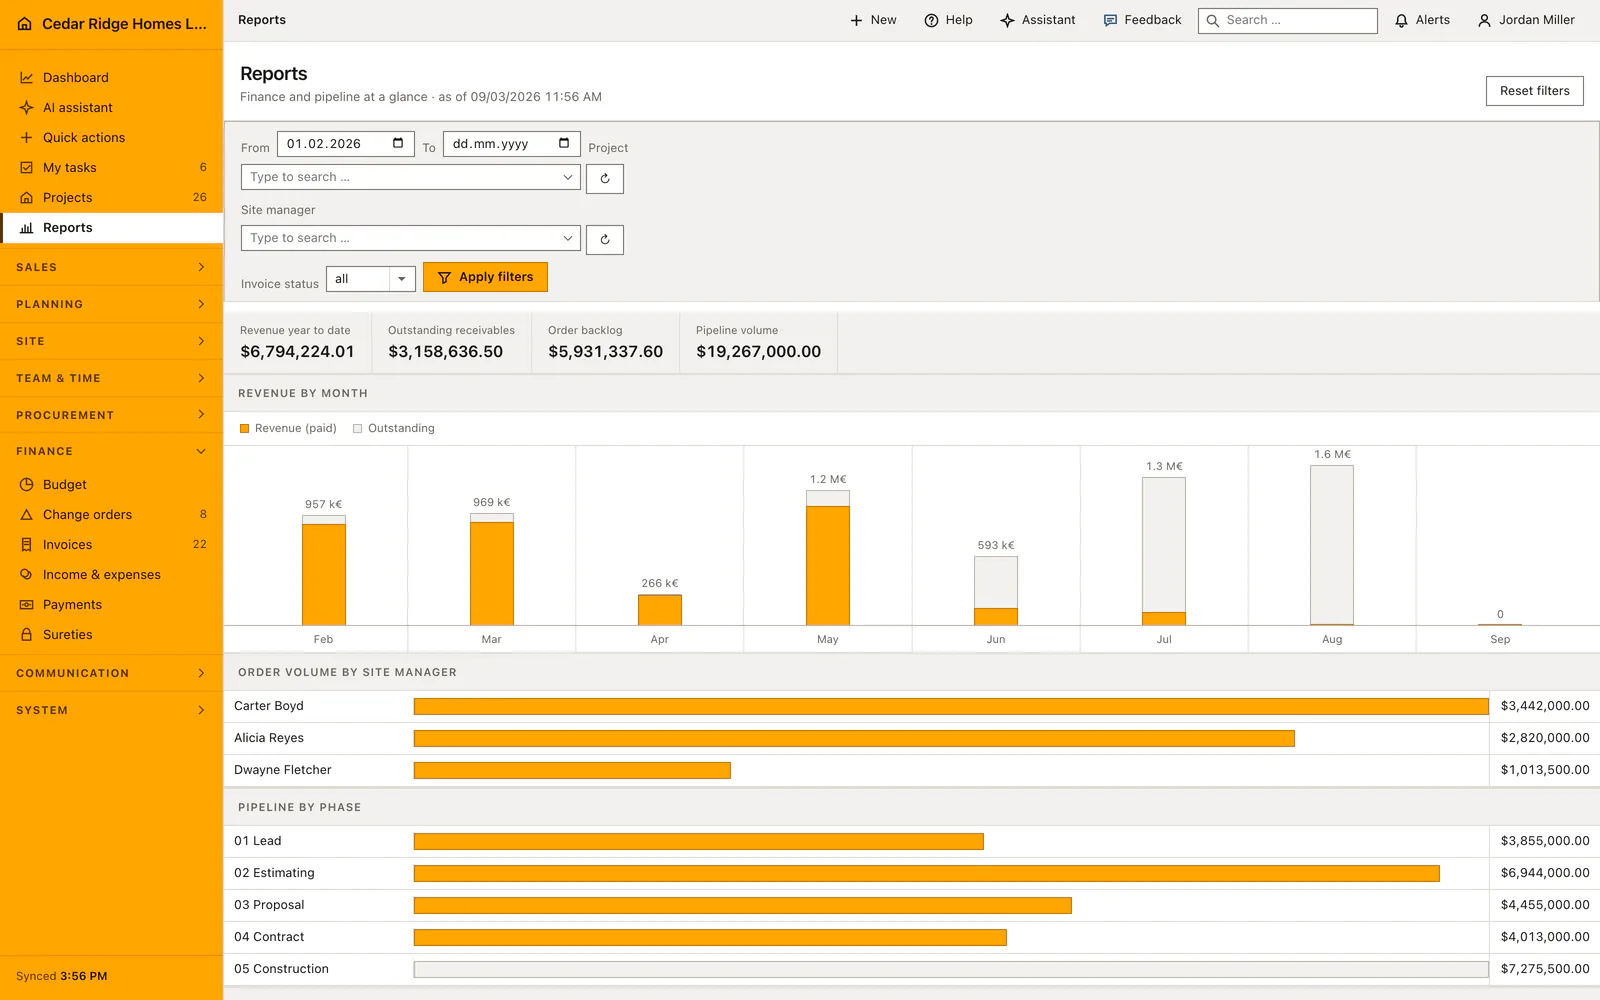
Reports puts finance and sales on a single page: four figures at the top, four charts underneath, all fed from the records themselves. Revenue for the running year, open receivables, backlog meaning work committed but not yet billed, and the volume of the pipeline. The monthly rebuild in a spreadsheet, followed by the argument about whose version is the current one, stops being part of the month end.
Revenue by month draws the last eight months as columns, orange for money already collected and gray for what is still open, with the monthly total printed compactly above each column. Contract volume per site manager sorts responsibility from largest to smallest. Pipeline by phase shows open opportunities from lead through to contract, with a gray construction row for comparison. Open items by age separates balances not yet due from one to fourteen days late and longer.
A status line at the foot states when the analysis was drawn and how many documents went into it, so a figure can be traced instead of believed. Everything calculates live: a payment received or an opportunity moved to another phase changes figure and chart on the next call. From the receivable ages the way on leads into invoices, where the same overdue balances are filtered, dunned and chased case by case.
Setting the date range, project, site manager and invoice status
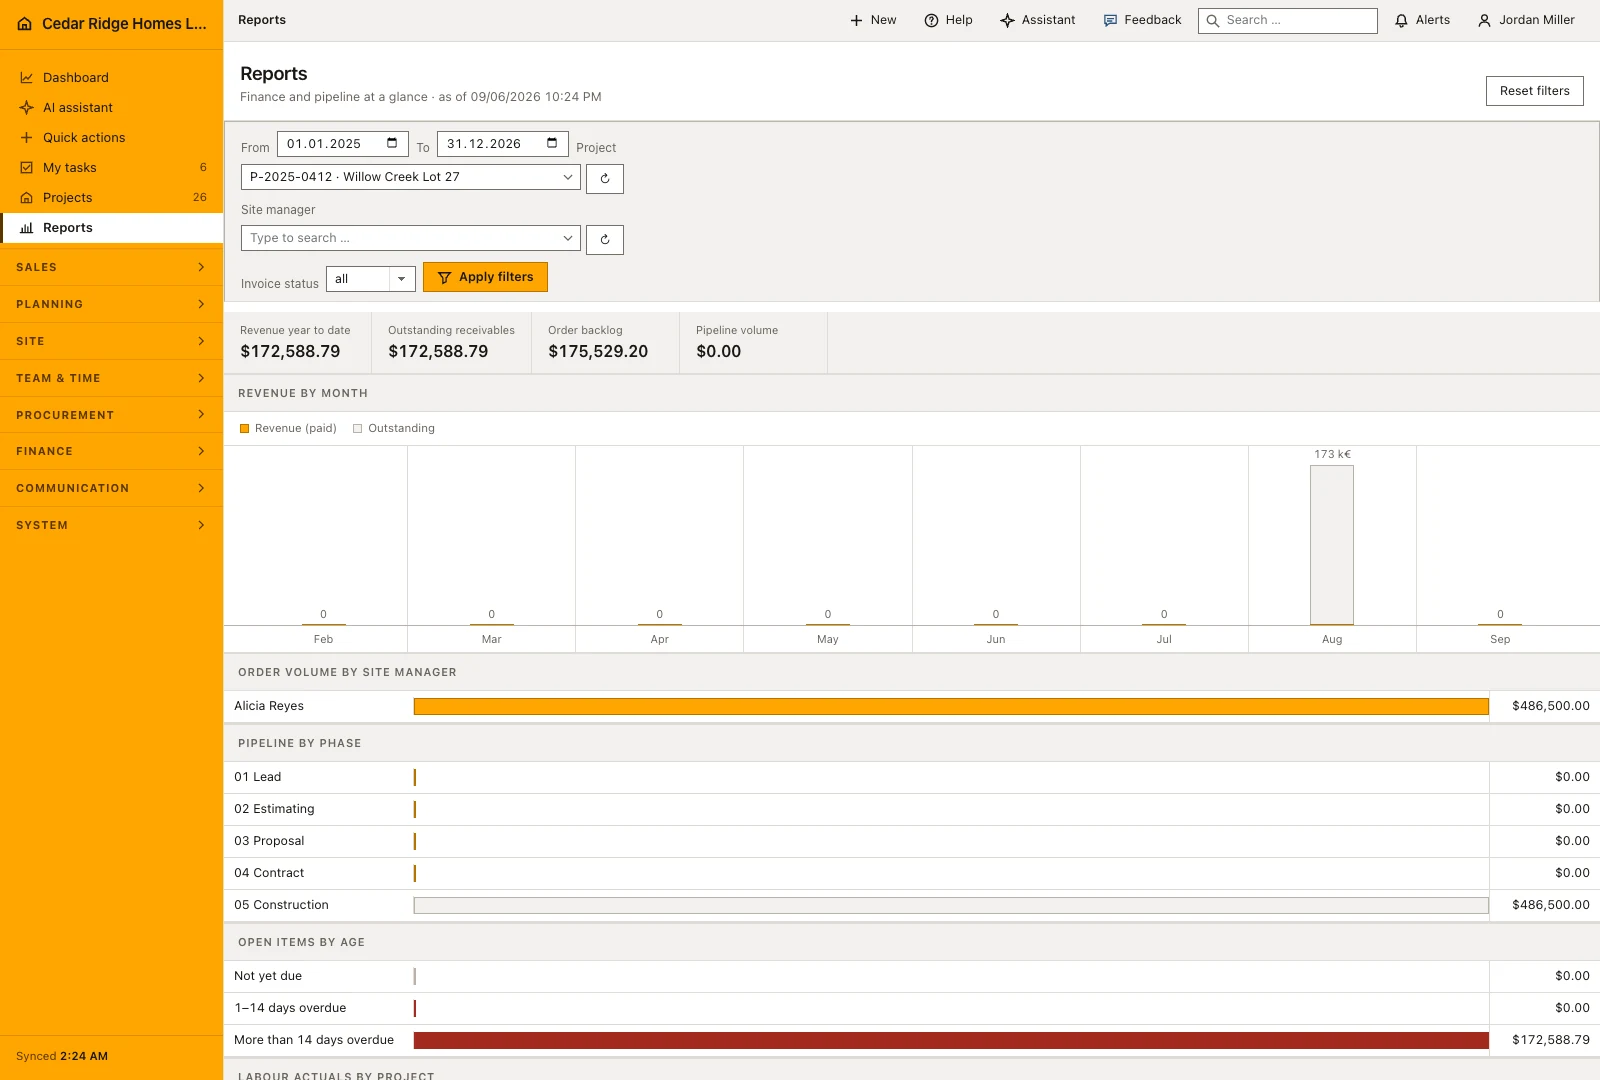
The filter row sits above the figures and applies to all of them at once. Without an explicit start date the page covers the last eight months, which is also the span the monthly chart draws; a start date reaching further back is accepted. The end date must not fall before the start date. Invoice status offers draft, open, overdue, paid and settled, and a project or site manager outside the company is refused.
Choosing one project narrows invoices, contract figures and labor to that job, and the pipeline chart empties, because an opportunity is not yet attached to a project. Choosing a site manager narrows projects and opportunities by responsibility and invoices by the jobs that person carries. A reset link appears as soon as any filter is set, and clearing it returns the page to its eight-month default.
 Open full-size screenshot
Reading revenue by month and open items by age
The monthly chart draws eight columns, the oldest on the left. The orange part is money collected, the gray part is still outstanding, and the compact total above each column reads in thousands or millions with the suffix of the active language. A month with no invoice shows a zero rather than a gap, which makes an empty winter visible instead of hiding it. Withheld retainage stays in the gray part until it is released.
Order volume by site manager sorts responsibility from largest to smallest and names a separate group when a job carries nobody. Pipeline by phase lists the four sales stages and adds running construction in a neutral tone for comparison. Open items by age splits outstanding balances into not yet due, one to fourteen days overdue and more than fourteen days overdue, both late bands drawn in red. Labor actuals group approved hours and their cost by project number.
From the aging chart into invoices, payments and pipeline
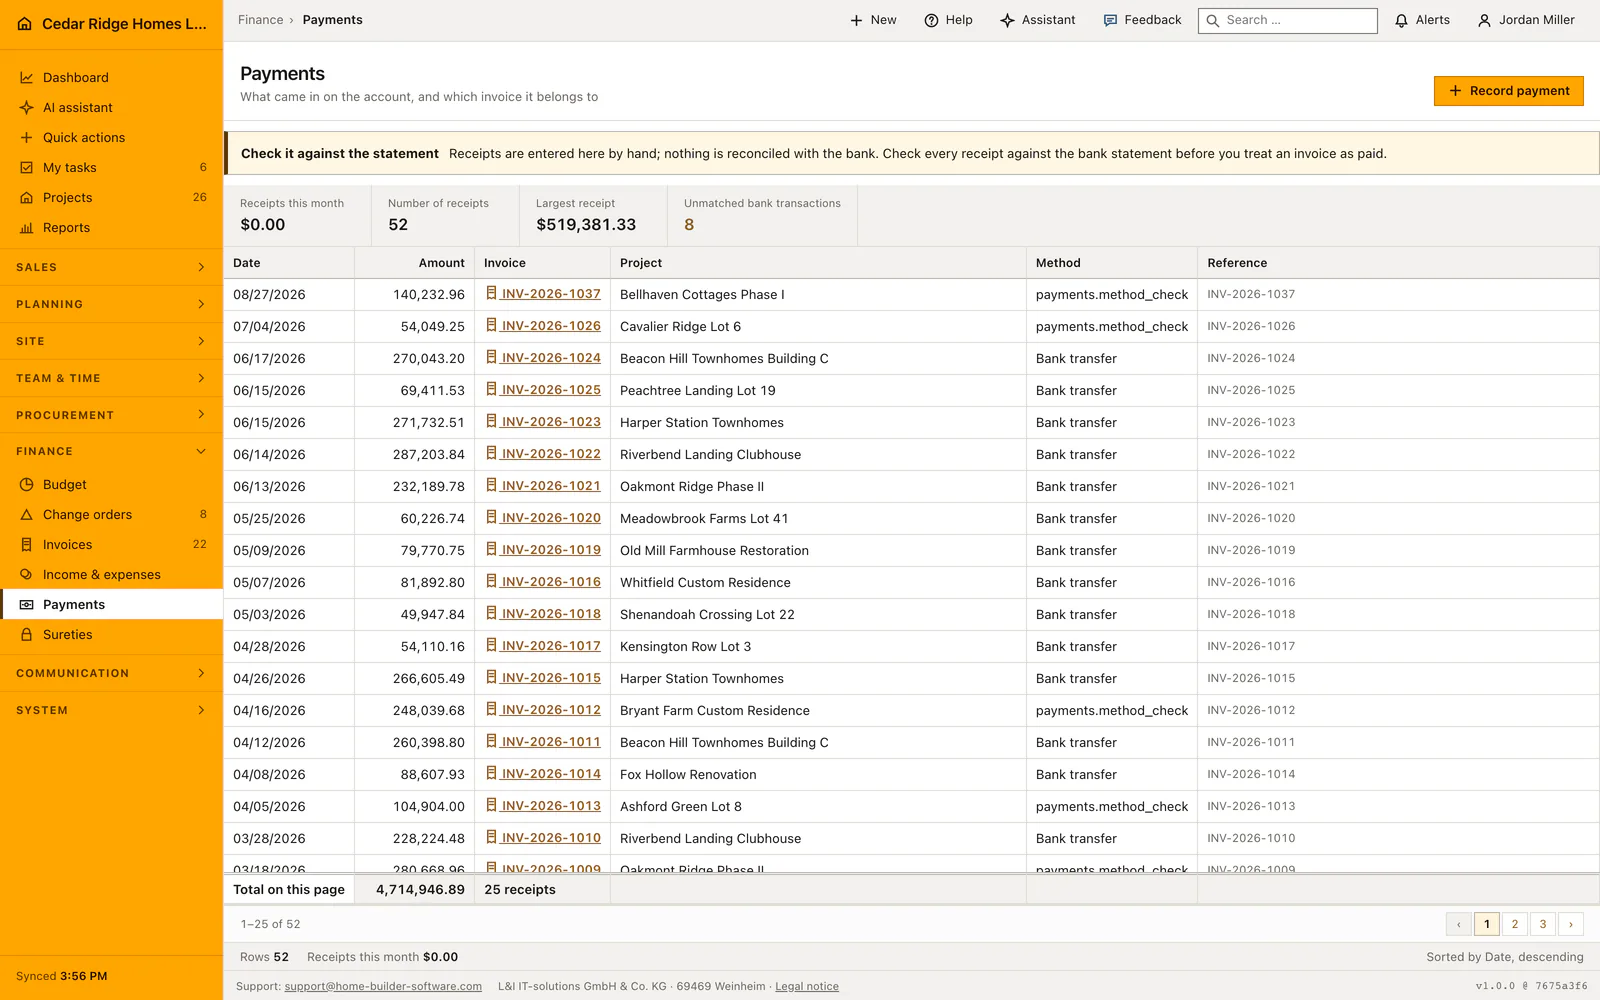
Reports names the problem; the modules solve it. An overdue band that is too large is worked in invoices, where the same documents can be filtered by payment state and a dunning run started. The collected share of a month moves when an incoming payment is matched in the payments module, either by hand or from a bank import. Nothing has to be recalculated afterwards, and the next opening of the page shows the new split.
The pipeline figures come from open opportunities, so a card moved on the Kanban board changes the phase chart, and a contract converted into a project moves its volume from the pipeline into the backlog. Order volume by site manager reflects what the project files say about responsibility, which makes a change of site manager in a project file visible here without any further entry. A corrected contract sum works the same way.
 Open full-size screenshot
Construction business reports in the daily routine
Owner and commercial lead open the page for the weekly review and start at open receivables, then read the age chart to see how much of that is genuinely late. Invoices takes over from there for the individual cases. Contract volume per site manager settles who is already carrying too much before the next job is handed out, and pipeline by phase shows whether sales is refilling what construction will finish this year.
Read the documentationConstruction business reports: what it covers
Compare paid and open revenue across recent months
Break contract and pipeline volume down by manager and phase
Identify overdue receivables by age from live invoice data
Construction business reports: questions and answers
Are report figures updated from current records?
Yes. Payments and pipeline changes are reflected when the report is opened again.
Can reports show which receivables are overdue?
Yes. The receivable-age view separates not-yet-due balances from overdue age bands.
Use Construction business reports on your own projects
Request a trial period for the workflow around this module. We agree the roles, permissions and useful scope with you before preparing access.